

I specified a point but received the following message: "Simulation data is either not yet available for this area or this area is not targeted for stimulation (the area is not expected to be flooded or there are no targeted rivers here)". What does it mean?
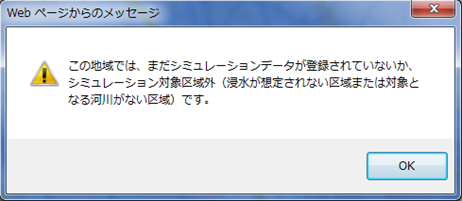
The rivers targeted for simulation are rivers designated as requiring flood forecast or requiring water level reporting according to the Flood Control Act. Click below for data available on this Web site.
This message is displayed even if the point specified is located only a little off the flood estimation range. If the flood simulation data for the river you are looking for is listed as available in the list of available simulation data, please move the point you specified a little and try again.
Please note that even if the simulation data for a river is not available on the Web site, flood estimation area charts are already created (click here for specified/released flood estimation areas) Also, you can access the flood estimation area charts on the Hazard Map Portal Site, etc.(click here for the Hazard Map Portal Site)
Why when I specified a point did the system display seemingly irrelevant information including the estimated levee failure points far away from the specified point and estimated levee failure points on the opposite bank?
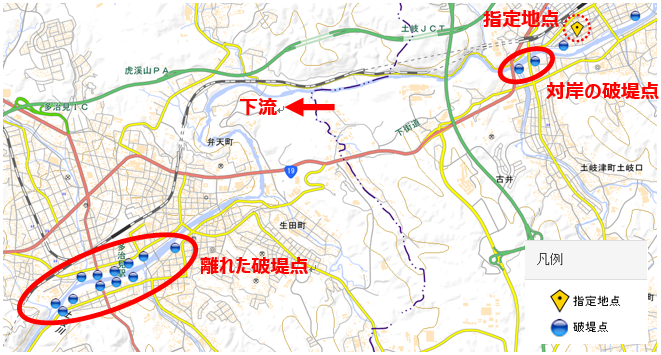
Depending on the river, we may estimate not only a flood resulting from a flood levee failure (breakdown of a levee), but also a flood due to an overflow (water overflowing in sections of the river not shielded with a levee) or overtopping (water overflowing in sections shielded with a levee). In such a case, since the flood estimation range for overflow or overtopping shall be added to the flood estimation range for flood levee failure, even levee failure point far away and levee failure points on the opposite bank may come up in the search and be displayed.
Why when I was enlarging the map to see an area in more detail, at a certain level of magnification it became impossible to enlarge any more?
Answer 3On this Web site, you cannot magnify the map more than a certain amount (it is not possible to go lower than 50m on the scale display in lower left of the map).
Animation started from the flooded state. Why?
Answer 4Depending on the river, we estimate not only a flood from an estimated levee failure point, but also a flood due to an overflow (water overflowing in sections of the river not shielded with a levee) or overtopping (water overflowing in sections shielded with a levee). In such a case, depending on the point specified, a point can be already flooded before the flood levee fails.
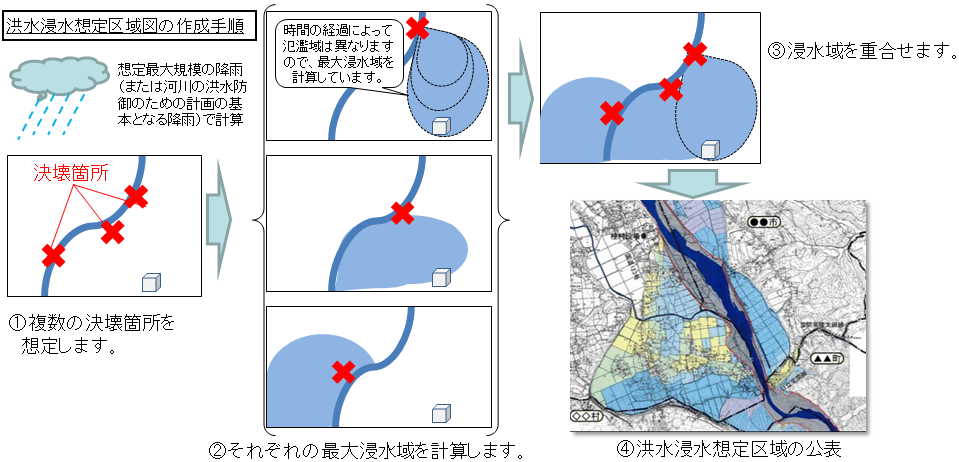
How are the flood estimation area charts made?
Answer 5Flood estimation area charts are created by the following procedure.
According to your estimations, at what water level does the levee break down?
Answer 6For sections of the river with a levee, simulation as a rule is conducted on the basis of assumption that the levee shall break down when water reaches the maximum assumed water level (water level serving as the basis for the blueprint of the levee, bank protection, etc.). For one simulation, however, we assume that the levee will break down in one place only (refer to answer for Q5 for details) and that all the other places will hold.
How do you determine the breakdown points (levee failure points)?
Answer 7When creating a flood estimation area chart, it is necessary to understand the areas that will be most flooded and the maximum water levels. For that reason, although it would be ideal to conduct simulations with floods originating at all of the points where the levee is estimated to break down, the system is set up so as to show, as much as possible, the breakdown points (levee failure points) that are the necessary minimum for the equivalent flood area and water levels. Please note that the levee may break down in other places than the ones set.
What are the damages for every flood stage?
Answer 8To make it easier for people to grasp the water levels at the area they live in and decide on the evacuation and the right attitude for the time when a flood happens, we set boundary lines (at 5.0m, 3.0m, and 0.5 m) to classify the water levels. Water levels marked by different colors mean the following for a two-storied wooden house:
What was the basis for choice of flood stages and their colors?
Answer 9Classification of the water levels (and marking them with different colors) was carried out in conformity with the Manual for Creation of Flood Estimation Area Charts (4th edition) published in July, 2015.